Automated
Column-Level Lineage to Secure End-to-End Data Integrity
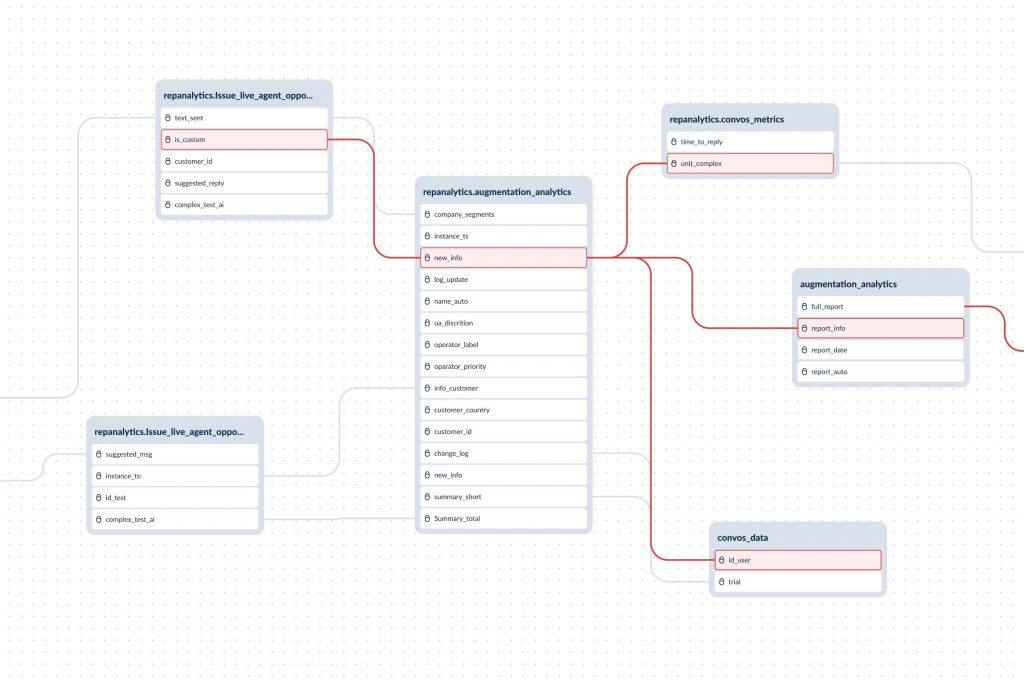
Masthead column-level data lineage visualizes how the data in your organization flows from its sources to data consumers. You and your data team can see all data inputs, outputs, and what happens in-between. Thus, data products become assets you can rely on.
Out-of-the-Box Data
Column-Lineage
Masthead connects to your data warehouse seamlessly, no code required. It parses data logs and analyzes queries to visualize the dependencies in your Google BigQuery. Masthead creates a lineage graph that reveals how your data is produced and consumed across tables, views, external tables, and dashboards.
Uncover Dependencies
Inside Your Data Warehouse, Even With Hundreds of Tables
We help you understand how any change in your data affects your data products, with a detailed technical lineage that shows which table, column, or view has been affected. Zoom in on any table and trace data flows down to the columnal level.
Trace the Implications of Data Issues Down to the
Data Consumers
We let you know what data consumers are affected. Masthead Data lineage connects with visualization tools to provide an instant view of what data consumers have been impacted by anomalies in the data warehouse.
Get Enterprise-Level Data Lineage
We let you know what data consumers are affected. Masthead Data lineage connects with visualization tools to provide an instant view of what data consumers have been impacted by anomalies in the data warehouse.
Get
Enterprise-Level Data Lineage
We let you know what data consumers are affected. Masthead Data lineage connects with visualization tools to provide an instant view of what data consumers have been impacted by anomalies in the data warehouse.
End-to-End Visibility
Give your team a complete view of where all their data comes from and what dashboards use it. Visual lineage drives data literacy and transparency across the board for data teams and business users.
Automatically Create and Maintain the Lineage
Track the changes in lineage in real time with ease. Automatic updates save the time your data team spends on manual data documentation and lineage mapping.
Database Migration Like a Pro
With automated, easy-to-understand lineage diagrams you can see at a glance how your tables connect with each other and how any single change affects the upstream and downstream data flows, both for your tech team and the decision makers.