Masthead Data is excited to introduce a new feature designed specifically for BI specialists who work with Looker. Starting today, you can prioritize specific Looker dashboards in Masthead, ensuring that BI engineers receive notifications solely about selected dashboards. This feature reduces the number of alerts for unrelated anomalies and errors, allowing users to focus only on those that impact Looker dashboards or reports.
Additionally, we’ve provided the ability to categorize Looker dashboards as “priority,” “regular,” or “muted.” This ensures that BI engineers remain focused on what matters most.
You can now view a comprehensive list of Looker dashboards affected by anomalies or errors within a notification. Alternatively, you can explore these connections and gather detailed insights in the Data Lineage. We have added Looker, which helps visually to understand Google BigQuery and Looker dependencies.
With this update, BI specialists can:
Receive immediate notifications when a top-priority Looker dashboard is down or experiences an anomaly.
Consolidate all affected dashboard elements in one location, making it simpler to identify erroneous data sources and affected data consumers.
Focus solely on Looker dashboards and reports, avoiding notifications related to other data system failures.
How do the Looker incidents work?
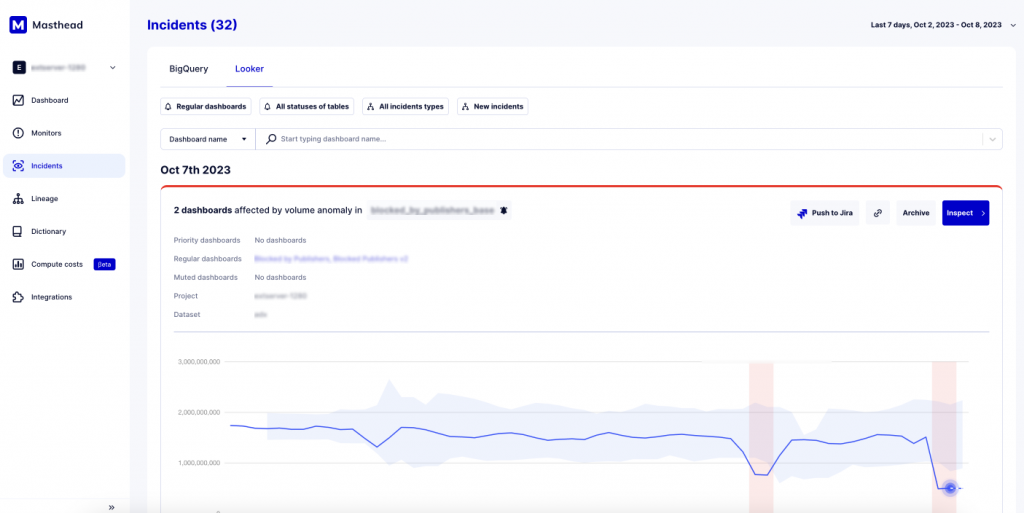
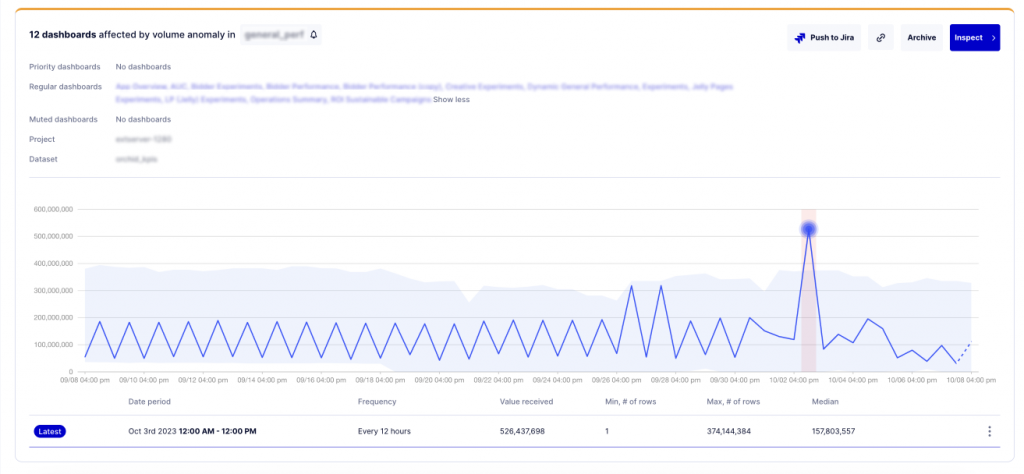
Ensure that Looker is connected to Masthead. If Google BigQuery sources any of the dashboards in Looker, any anomaly related to BigQuery tables that affects those Looker dashboards will be displayed in the “incidents” tab (Looker).
The incident will include a list of all dashboards affected by a particular anomaly, enabling users to assess the implications and address the issue comprehensively.
How does the Looker Dictionary work?
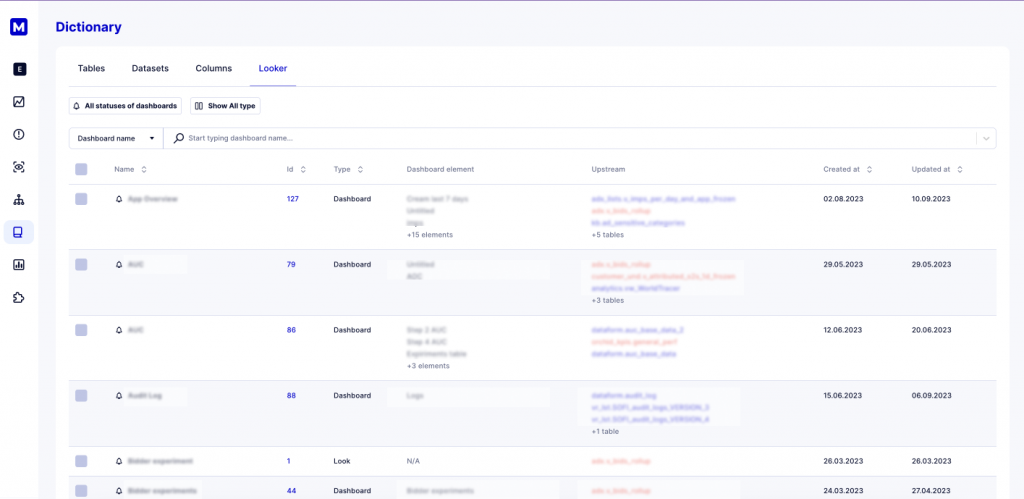
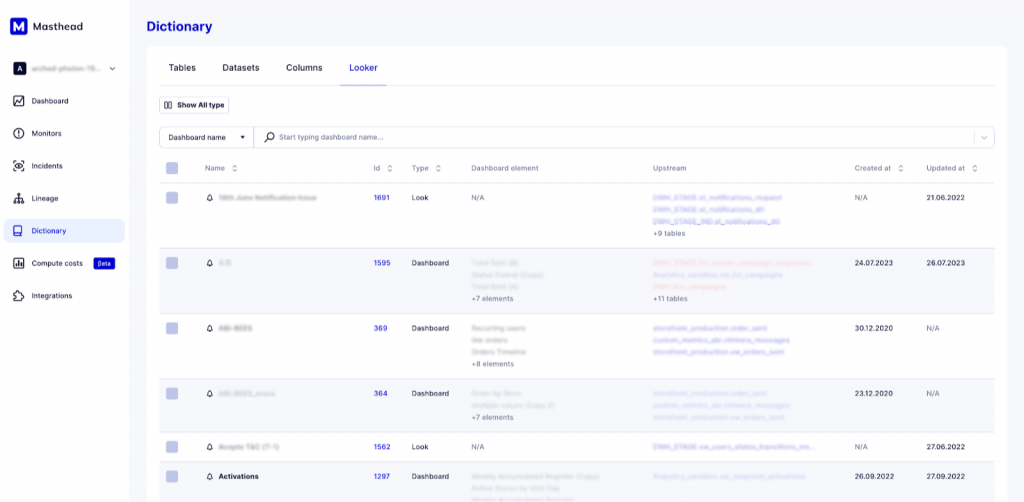
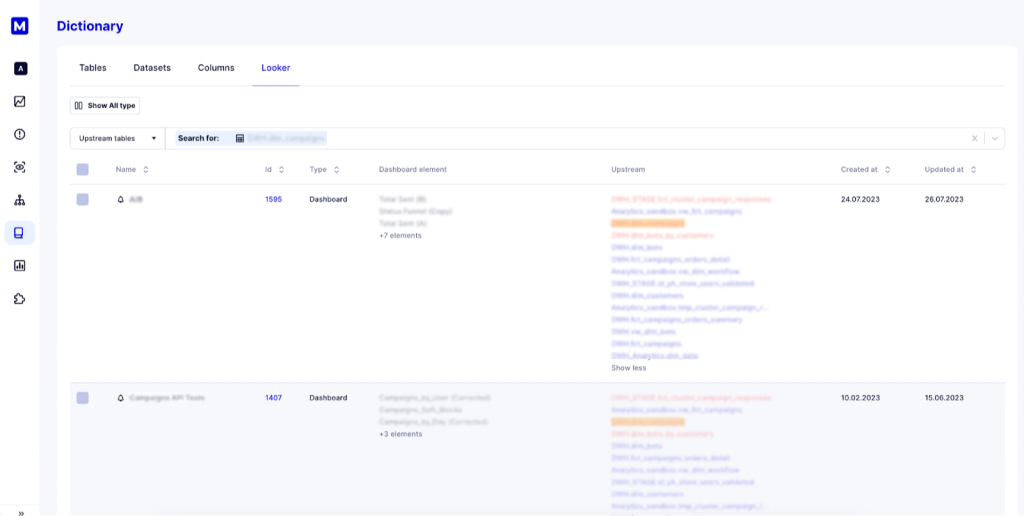
The Data Dictionary now contains a list of all dashboards available in the connected Looker. This simplifies the understanding of data sources and the dashboard elements in use.
This provides a comprehensive view of dashboards, or data products if you prefer, used within the organization. It includes links to the actual Looker dashboards, a list of dashboard elements, a list of Google BigQuery tables, as well as their creation and last update dates.
The Looker Dictionary is also designed to simplify searches. Users can search by dashboard name, dashboard ID, dashboard element, or any source table upstream for a Looker dashboard.
30 Jul 2023
Looker Dictionary
Masthead Data introduces Looker Dictionary, empowering you to spot issues in your Looker dashboards before they reach data end-customers. Gain full visibility into your data products and know how anomalies in pipelines and tables affect business users in Looker dashboards. This update, enables smart searches by dashboard IDs, look names, look IDs, dashboard elements, or upstream tables, which simplifies management of Looker assets.
With this new feature, you can review the type of your Looker data product (whether it’s a look or dashboard), its core elements, owner, the upstream tables used, as well as its creation and update history of the dashboards.
You can also reach any of your Looker dashboards by just clicking on its ID in the Masthead Looker dictionary.
Dictionary for Looker helps you to:
Get alerts about errors and anomalies that may impact your Looker dashboards long before they ever reach your customers, which is especially critical for BI engineers.
Manage Looker entities in a single space. Know how many Dashboards and Looks are in Looker, when they were created and last updated, who is the owner.
Run a fast and intuitive search for your critical Looker asset.
How does this feature work?
Once you connect Looker, go to the “Dictionary” tab and choose “Looker Dictionary.”
Masthead displays you a full list of your Looker assets, supported with interactive search options, critical information on your data products, and an opportunity to review all upstream tables affecting your dashboards.
Note that Masthead Data is a non-intrusive data observability solution that processes only metadata without accessing the actual data in your Looker.
27 May 2023
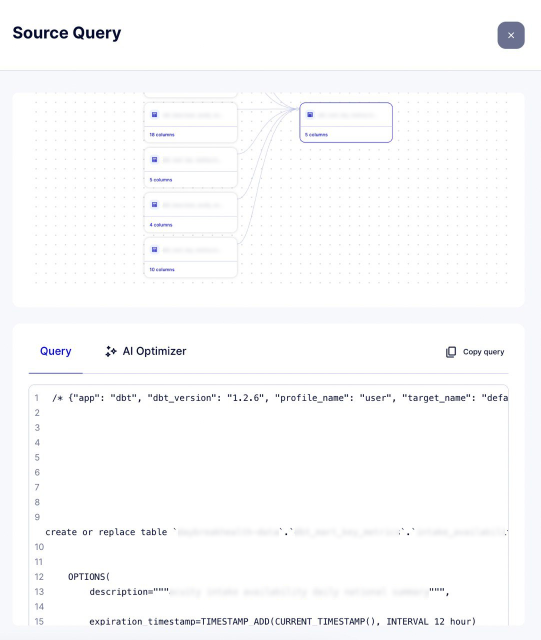
Query Optimizer
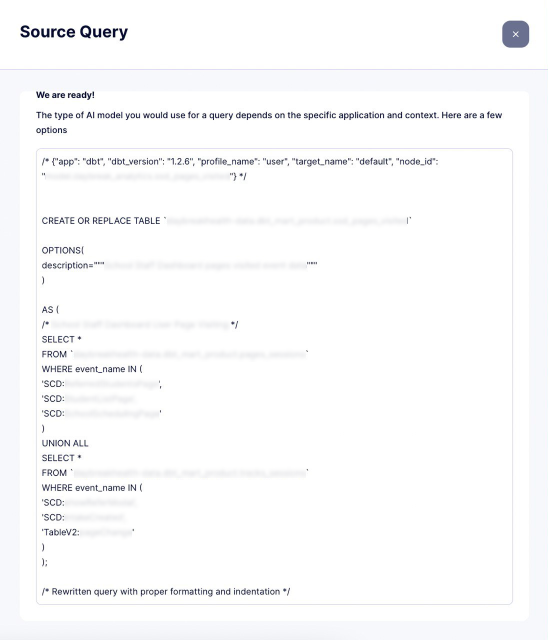
Masthead Data has recently introduced a new feature that enables you to optimize your SQL queries using OpenAI GPT. With this latest update, you now have the option to select any query captured by Masthead and utilize the AI Optimizer to receive recommendations on how to improve it.
With this feature you can:
Enhance the effectiveness of your SQL queries by following best practices recommended by the world’s foremost AI agent.
Reduce the cost of your SQL queries by improving their overall quality.
Receive valuable recommendations that may help you refine your query-writing approach.
The AI Optimizer ensures that your table contents remain private and are not shared with the AI agent. It only shares metadata with OpenAI to enhance the query-writing capabilities of GPT.
How does this feature work?
Select any SQL query from the “Compute Costs” tab and review it. If you wish to improve this query, simply click the “AI Optimizer” button.
Masthead sends a request to OpenAI GPT and provides you with a response containing a recommendation for enhancing the query. It is entirely up to you to decide whether to use the recommended query.
Note that Masthead Data cannot guarantee the accuracy of the output in every instance. Hence, we strongly advise you to thoroughly review the recommended query before executing it.
27 Apr 2023
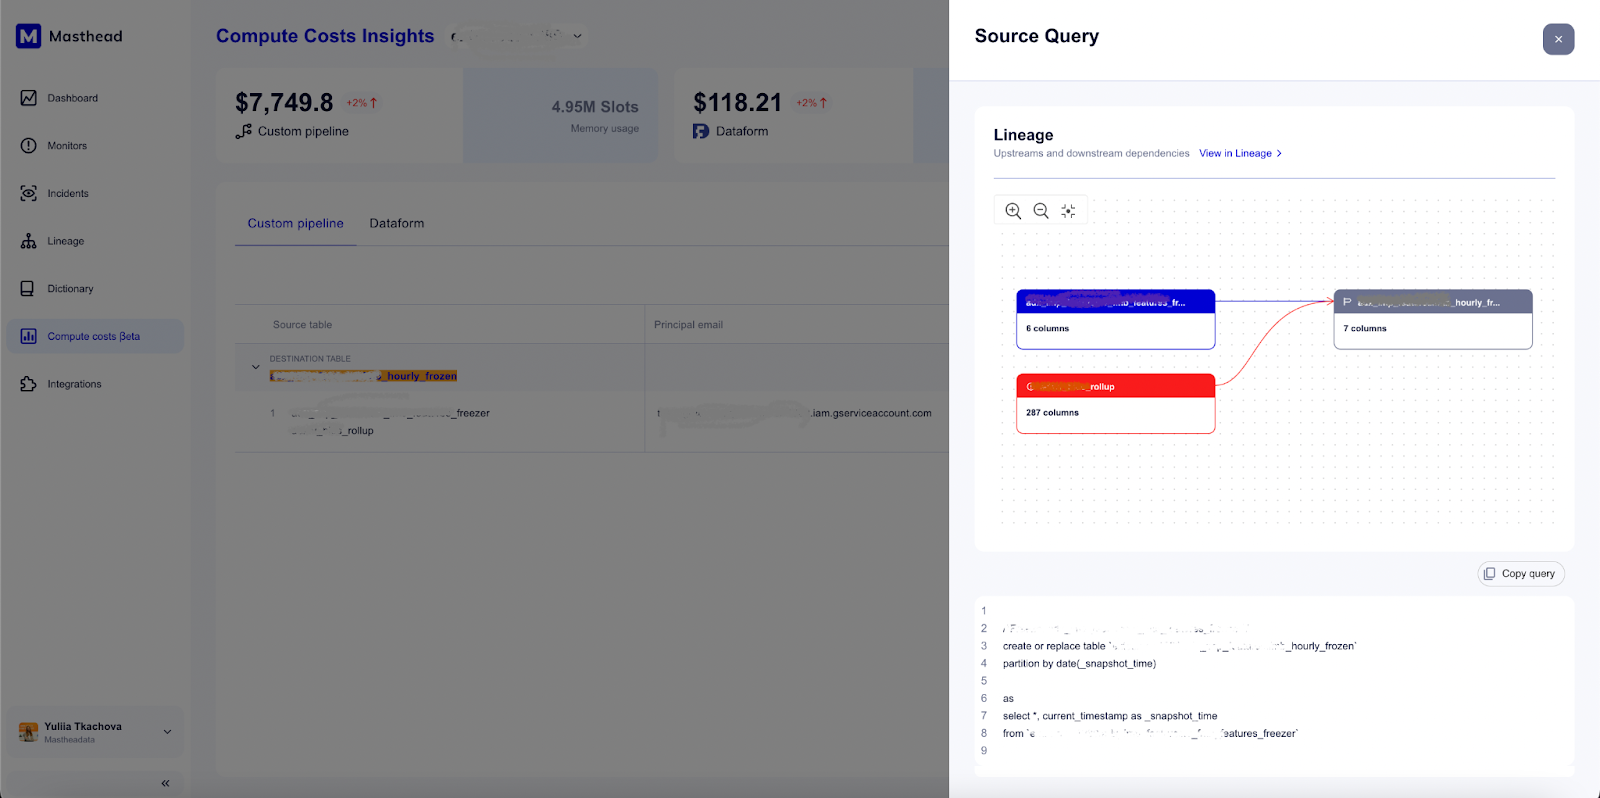
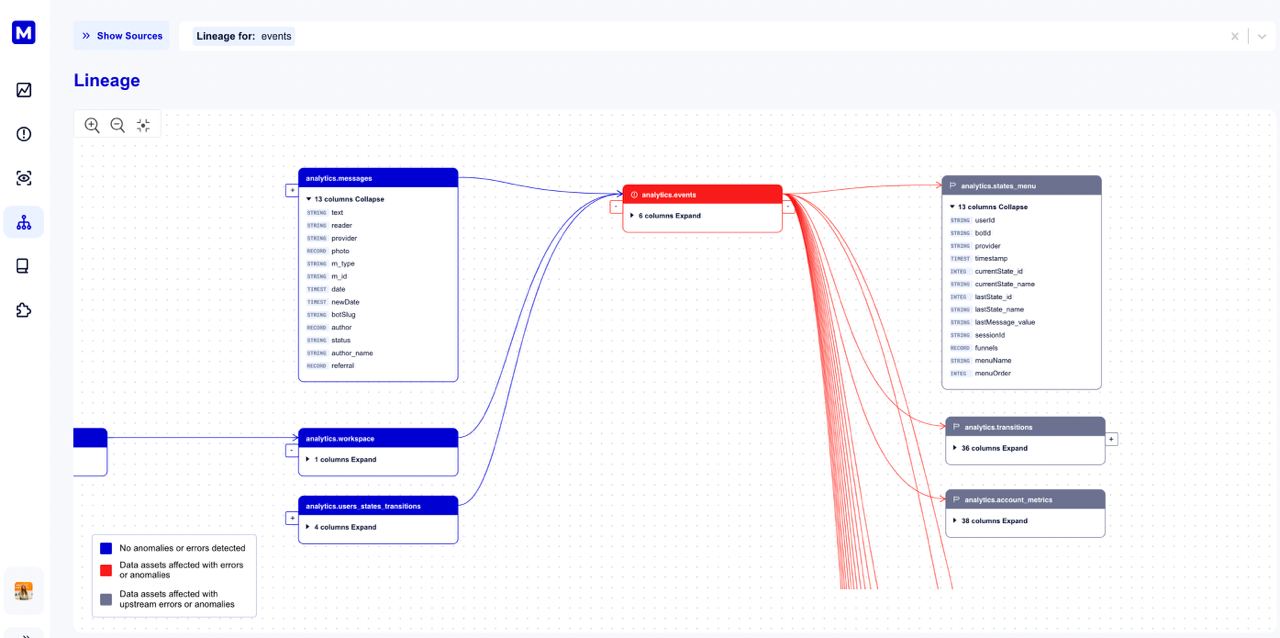
Column Data Lineage
Masthead Data has just released an update to its data lineage feature, allowing you to gain the most comprehensive insight into your data. Going forward, you’ll be able to see the connections between your data tables down to the smallest details of each table column. By highlighting related columns across different tables, Masthead enables you to understand how each column affects downstream data.
With this update, you get:
Opportunity to dig deep into your data tables and pinpoint the exact connections between them
Ability to identify and track the root cause of data anomalies affecting your tables all the way down to the specific table column
Complete and clear observability of your data flows and connections down to reports in Looker
How does this feature work?
While checking your data lineage, click the number of columns in a table in the Lineage tab.
You will visualize your table column dependencies and see how each of your table columns affects related columns across different tables.
14 Apr 2023
Integration with Looker
Masthead Data offers you complete control over the quality of your Looker’s data visualizations and dashboards. No one is immune to bad data, which can quickly spread and impact the quality of downstream tables that Looker dashboards rely on. By integrating Masthead with Looker, you can quickly identify reports and dashboards affected by data anomalies and easily visualize the root cause of the problem with data lineage.
This update provides you with the following benefits:
Complete control over the quality and reliability of your Looker reports and dashboards
Clear view of the interactions between tables sourcing Looker reports, allowing you to effortlessly trace the data path throughout the platform
Ability to identify and track down to the root cause any anomalies that affect your Looker reports and dashboards
How does this feature work?
Follow the instructions to create Looker configurations and allow Masthead to observe your Looker dashboards and real-time reports.
Visualize your table dependencies with data lineage to see how bad data spreads across your data tables and identify Looker reports and dashboards affected by the data anomaly.
30 Mar 2023
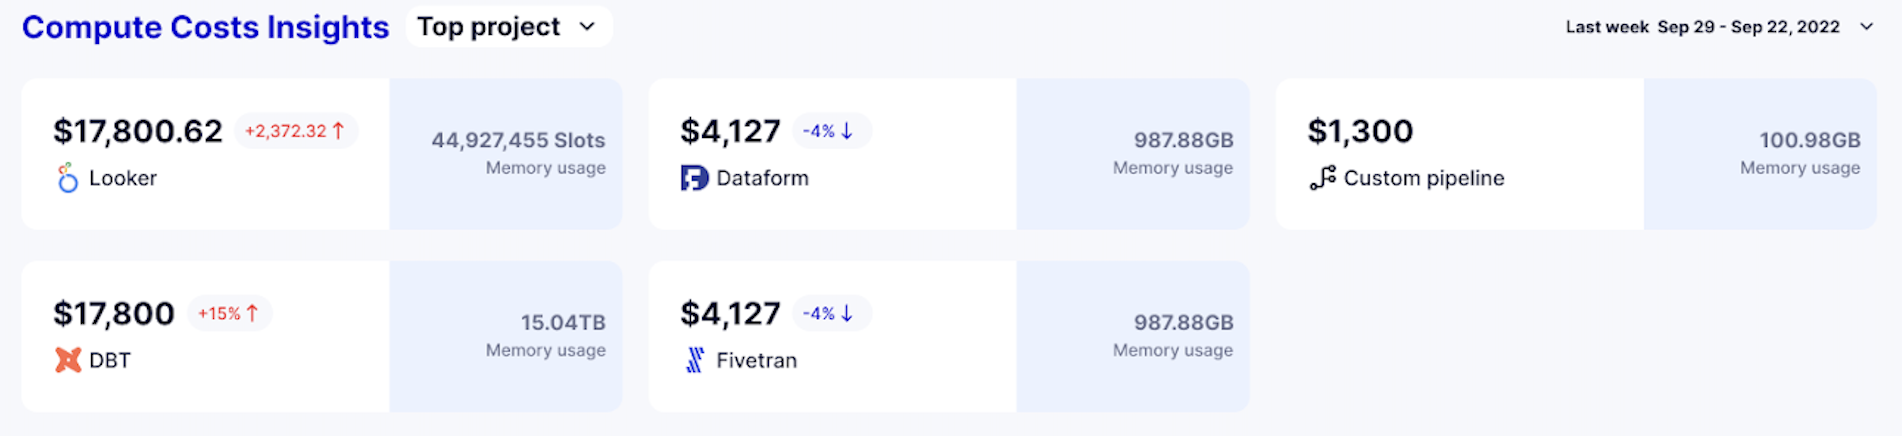
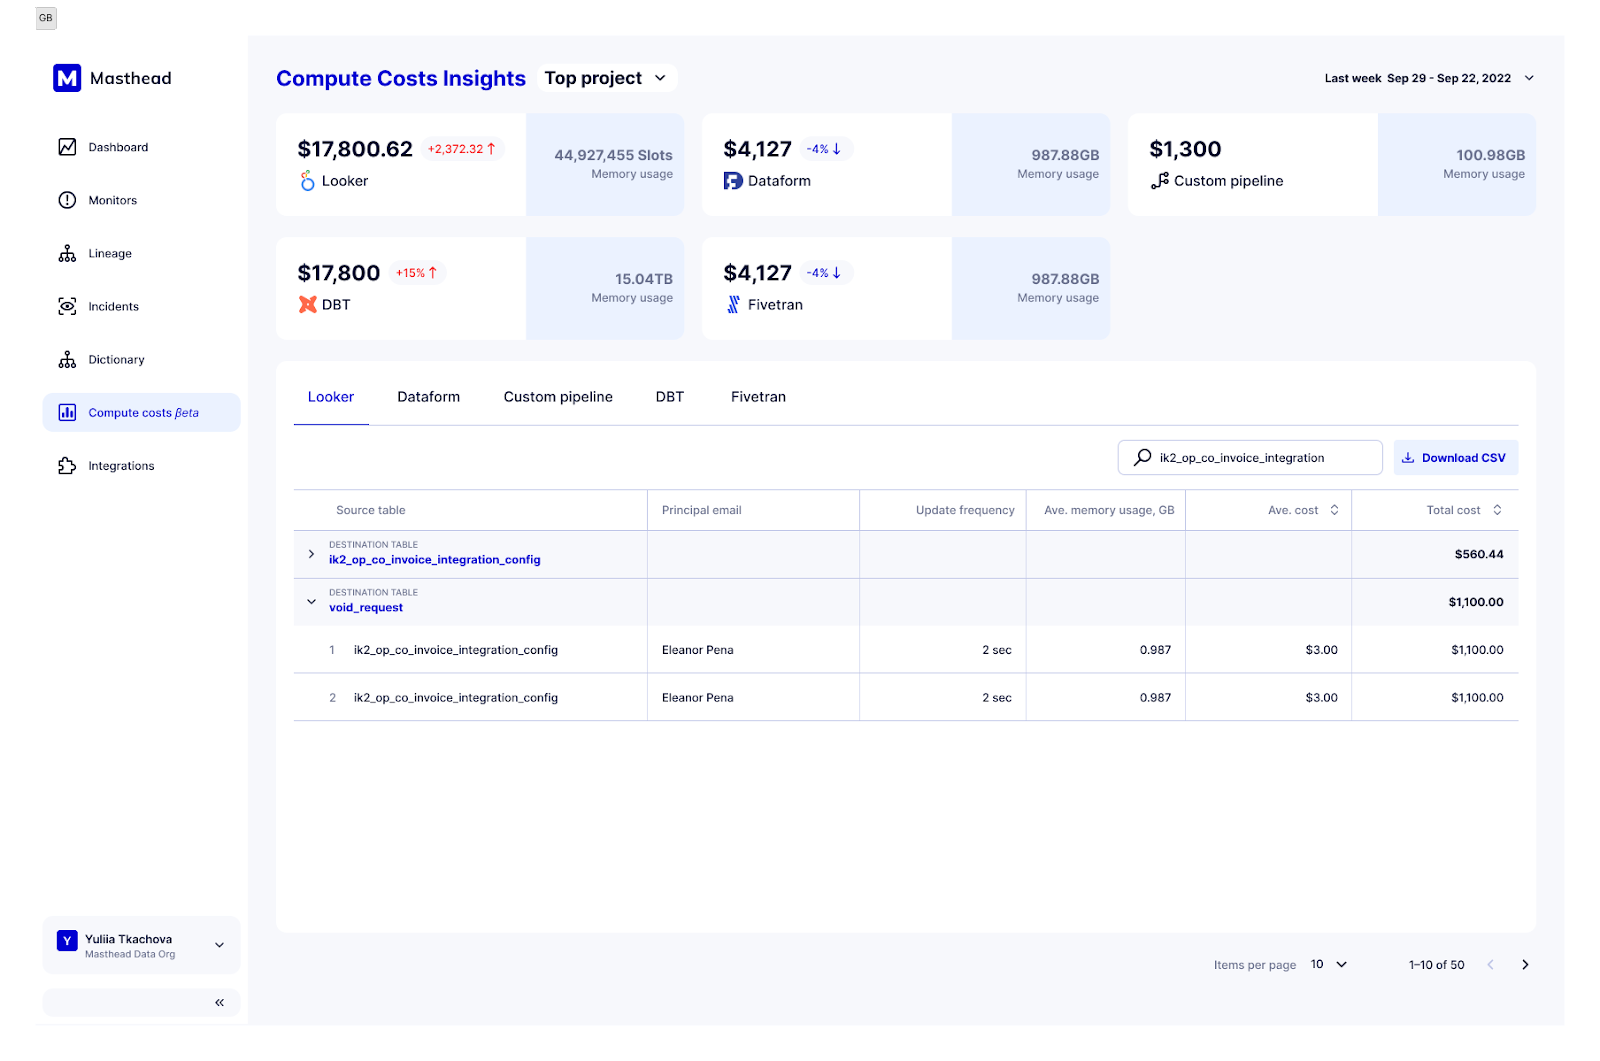
In-depth cloud cost tracking. Beta
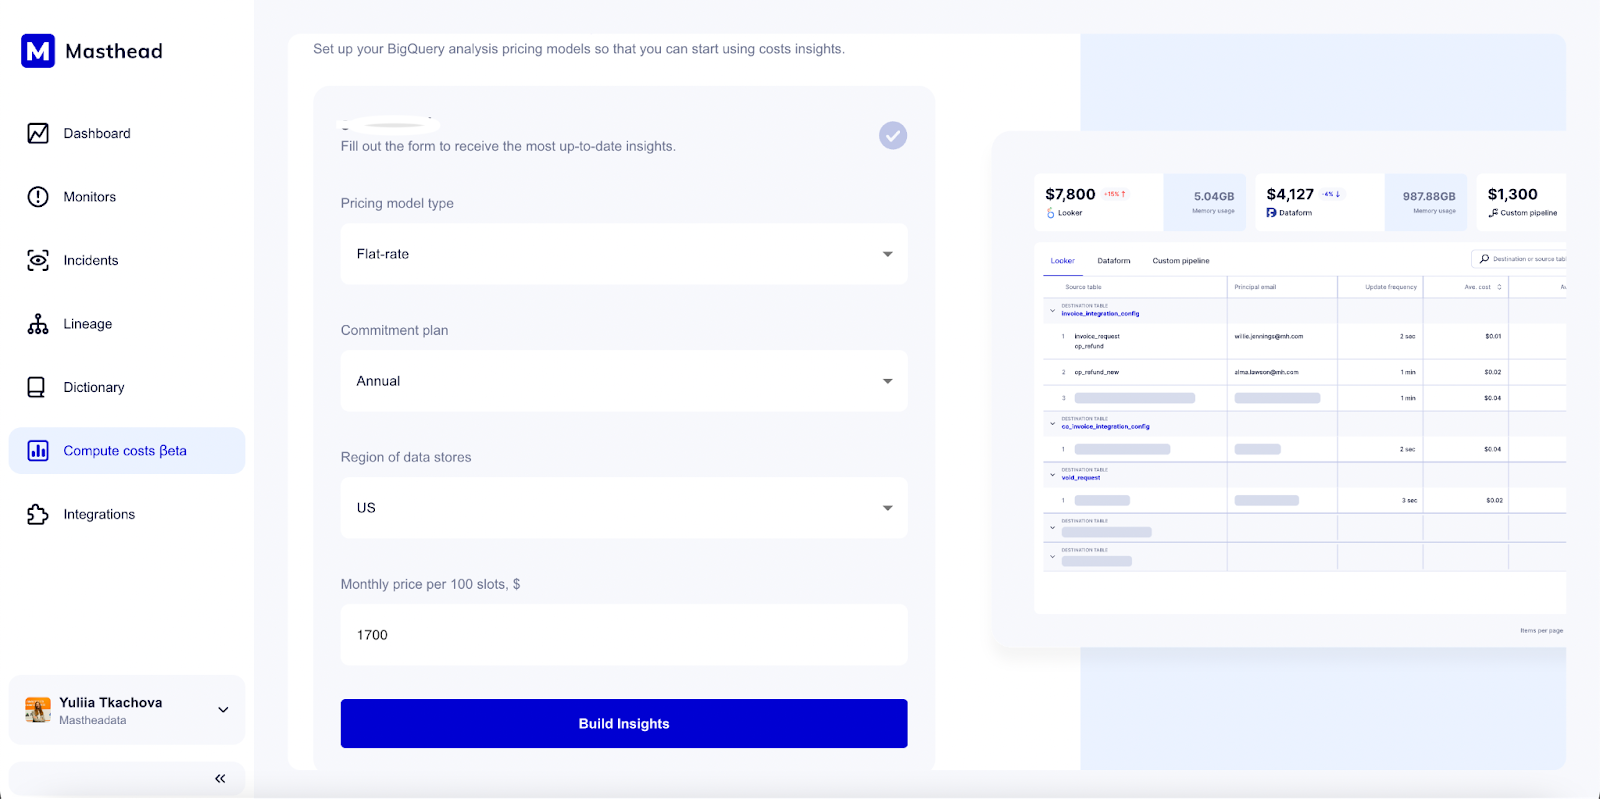
Masthead Data introduces advanced functionality for managing your BigQuery fees. Normally, BigQuery only shows the total cost of using the cloud service, without any information on how individual pipelines and queries contribute to this fee. However, with our latest update, you can easily track the cost of each pipeline and query, giving you complete control over your pricing dynamics. Our new feature includes the following benefits:
Full control and analytics over the cost of your data pipeline
The ability to track the frequency, average memory/slot consumption, average cost, and total cost of your query requests for both BigQuery On-demand and Flat-rate pricing models
Cloud cost consumption tracking for database services and tools such as Looker, Fivetran, dbt, and Dataform
The ability to view the price and cloud resource consumption dynamics for different query requests and pipelines within a set timeframe.
How does this feature work?
When you onboard to Masthead, define your BigQuery pricing model.
Indicate the region where your data centers are located and see the price you pay for a terabyte of cloud resource or 100 slots of cloud compute power, depending on your commitment plan.
With our new feature, you will get a detailed overview of TB or slots consumed for running your pipeline, as well as detailed analytics on your cloud resource consumption and pricing dynamics. Here you can also check how additional database tools and services, such as dbt, contribute to your cloud cost.
With our latest feature, you’ll get a detailed breakdown of how much cloud resource you’re consuming or how many slots you’re using, and in-depth analytics on your consumption and pricing trends. You can even see how additional database tools and services, like dbt, are impacting your cloud cost.
If you want to review the pricing dynamics of individual queries, you can easily do that too. If you’re using an On-demand BigQuery pricing plan, Masthead will show you the query’s frequency and time, average memory usage in terabytes, average cost per terabyte, and total cost. For Flat-rate BigQuery subscribers, you’ll see an overview of the query’s frequency and time, the number of slots required to run it, average cost per slot, and total cost.
On top of that, you are able to check the query and its lineage of your pipeline.
With Masthead’s detailed analytics and breakdowns of your cloud resource consumption and pricing, you can stay on top of your cloud cost. By identifying which pipelines and queries are consuming the most resources and cost, you can make informed decisions and optimize your usage to pay less and save money.
26 Dec 2022
Lineage improvements
Effective data governance is critical for making informed and reliable decisions. As data engineers handle vast amounts of data at high speeds, it is crucial to have a clear understanding of the origin and transformation of the data. This is where data lineage comes in – it helps to ensure that the data being used is trustworthy, accurately transformed, and stored in the correct location. By tracking the lineage of data, organizations can ensure that strategic decisions are based on high-quality data.
We are excited to announce an update to our data lineage:
Visual enhancements to help identify data assets that have been impacted by anomalies or errors.
Users can now view the type of every field within the data lineage, providing greater clarity and detail in the tracking of data transformation.
Courtesy of Masthead Data
Masthead Lineage feature now includes visual highlighting to clearly identify tables that have been impacted by data anomalies or errors. Grey highlighting is also used to show downstream tables or views that may be affected by these errors.
In addition, we have carefully evaluated the color contrast of our Masthead UI and data lineage tools to ensure they meet accessibility standards outlined in the Web Content Accessibility Guidelines (WCAG). This includes considerations for individuals with color blindness, making our platform more inclusive for all users.
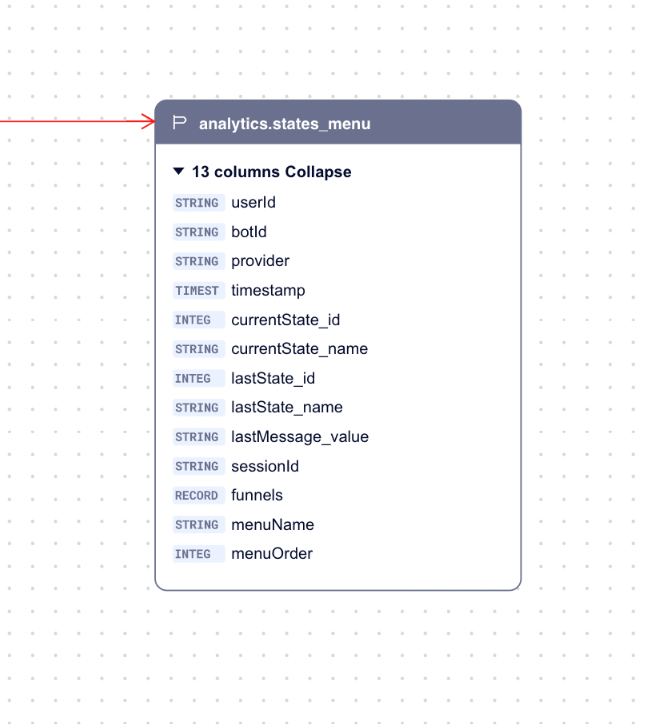
The Masthead Lineage now provides types of data in column-level lineage, allowing data engineers quickly see the types of data within each column.
Courtesy of Masthead Data.
This level of granularity is crucial for understanding the transformation and flow of data and its use downstream.
14 Nov 2022
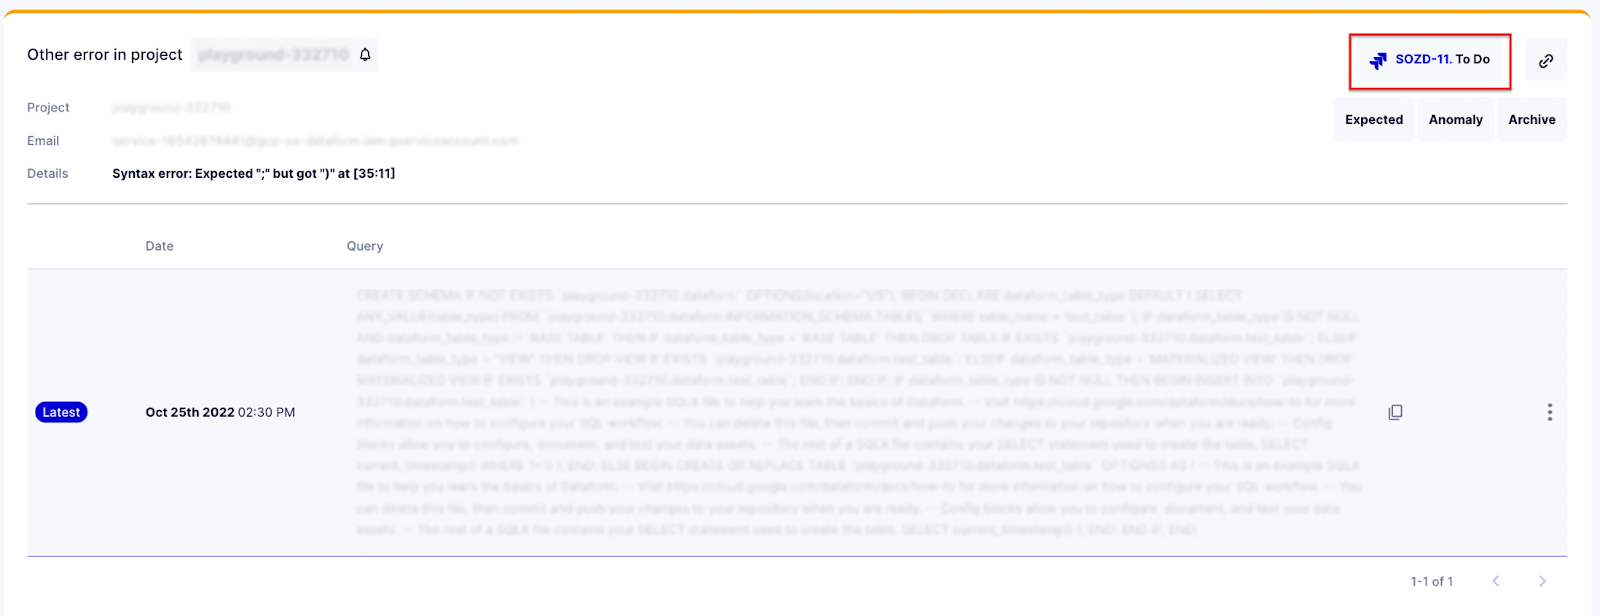
Jira Integration
Masthead takes a solid step towards more efficient issue management. From now on, you can immediately find people associated with the detected data errors and collaborate to solve data issues faster. Jira integration enables:
More control over issue detection and solution process.
More convenient interface for data teams responsible for data processing.
How does this feature work?
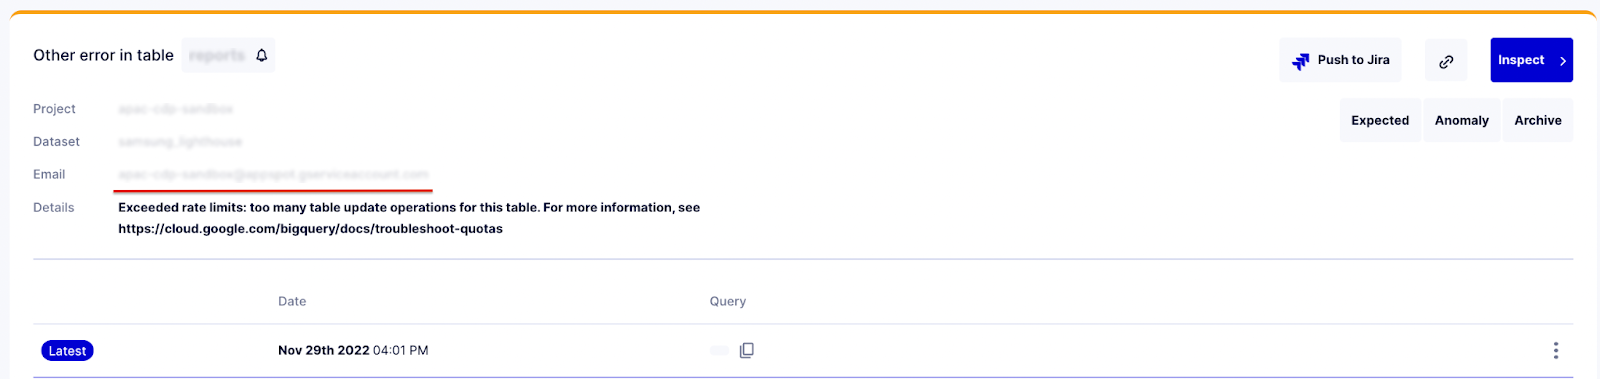
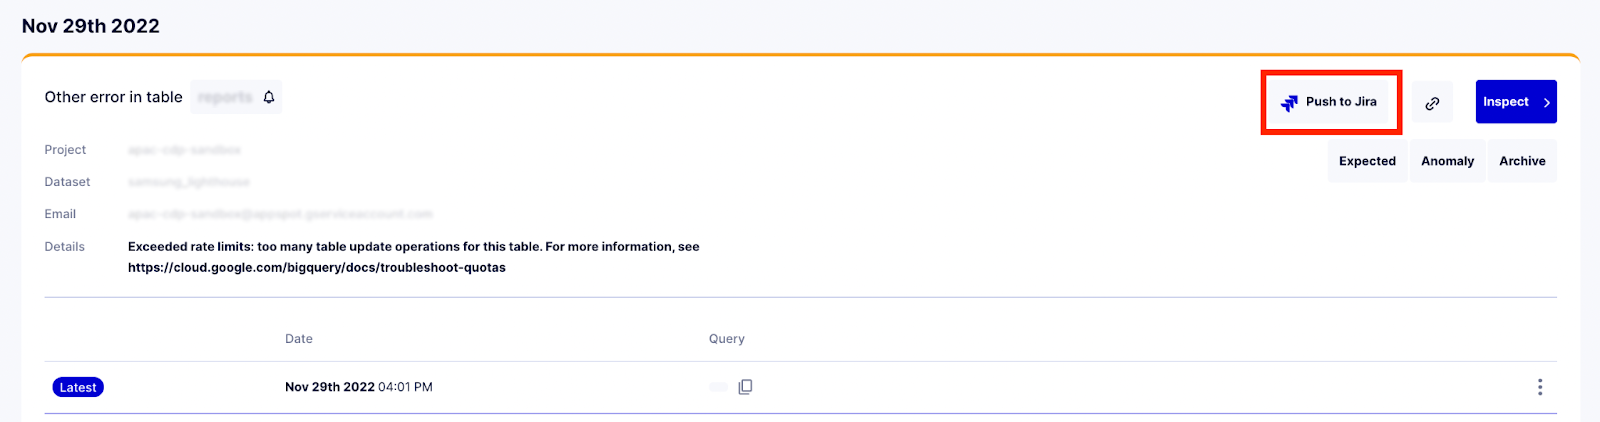
When you review a particular error in a table (dataset, project), if applicable, you can see a service account that is associated with this error.
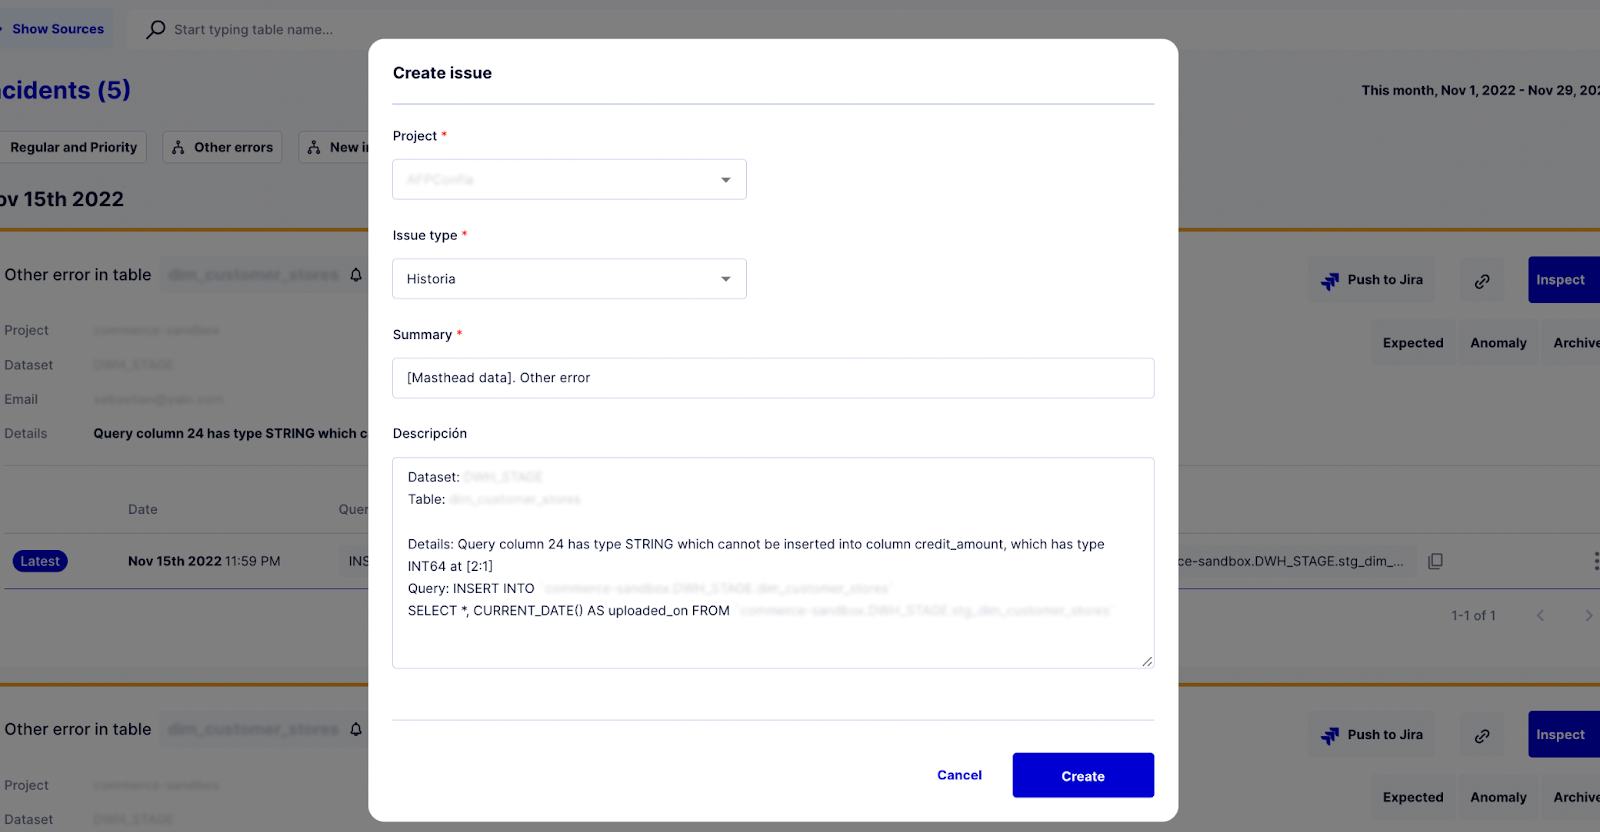
Use the “Push to Jira” button to automatically create a Jira ticket that can be populated to the Jira board of the appropriate team to resolve it faster.
The team will receive the notification about the new ticket. The ticket includes the problem summary, details, and a description or other required information. After that, the appropriate team can timely start analyzing and resolving the data issue without any back-and-forth messages needed for problem clarification. This allows you to speed up task delivery and distribution, as well as helps you process the problem in the shortest terms.
Once the Jira ticket is created at Masthead UI, you can check its number and status until it is resolved. So everyone on the team has a shared understanding if someone takes care of the data issue and its progress.