Masthead, a data reliability platform, presents new cost optimization feature for Google BigQuery optimization. This solution helps businesses reduce their BigQuery compute costs by intelligently switching between On-demand and Editions pricing models.
The Challenge of Choosing Between On-demand and Editions pricing models
Google Cloud team does not give you an instrument to answer the question: which plan is more cost effective for my current Google BigQuery workloads. Apart from many different setups and pricing option the client has, it is not obvious which billing plan is better for the client in slots or in GiB.
In defence its had to compare those, if you thing of it, GiB (bits) is a unit of measure the the network speed and computing in the network, while slots are virtual CPUs. Conceptually, is two different things that is hard to compare. But what is important those two can work in parallel for your benefit. The BigQuery compute cost can be different on a project level and you can assign appropriate billing model depending on the density and volume of your workload.
Existing Google BigQuery Pricing Solution
Google Cloud BigQuery calculator

Screen recording from the Google Cloud BigQuery calculator.
First of all it is the calculator for BigQuery including storage, it does not help to estimate the cost of your project in Editions, it rather helps to understand the ballpark of figures you will pay by putting the numbers out of your head.
The biggest problem with it, does not give any clues to customers if they should move to slots or stay on On-demand (GiB).
The drop down suggest the amount of slots, but the question remains how many slots do you need? Not to mention, what autoscale should be expect?
Is it possible to calculate precisely on a project level whether it is better to go for Editions or stay on-demand?
The fun things is that BigQuery gives you the ability to track the cost of your BQ on a job level which is incremental and unique run of any operation in BigQuery, but the job cost is just to granular to understand how much the pipeline cost. In sense that you also need to know the frequency and the not all their runs are the same. The same pipelines can have different data volume on different days or daytimes (if on-demand pricing) or different duration if we are talking about editions pricing models).
So there is no way the user can understand which jobs related to which pipelines which makes it hard to estimate the cost switching to new billing plan.
Masthead’s Solution: Intelligent Switch for Optimal Savings
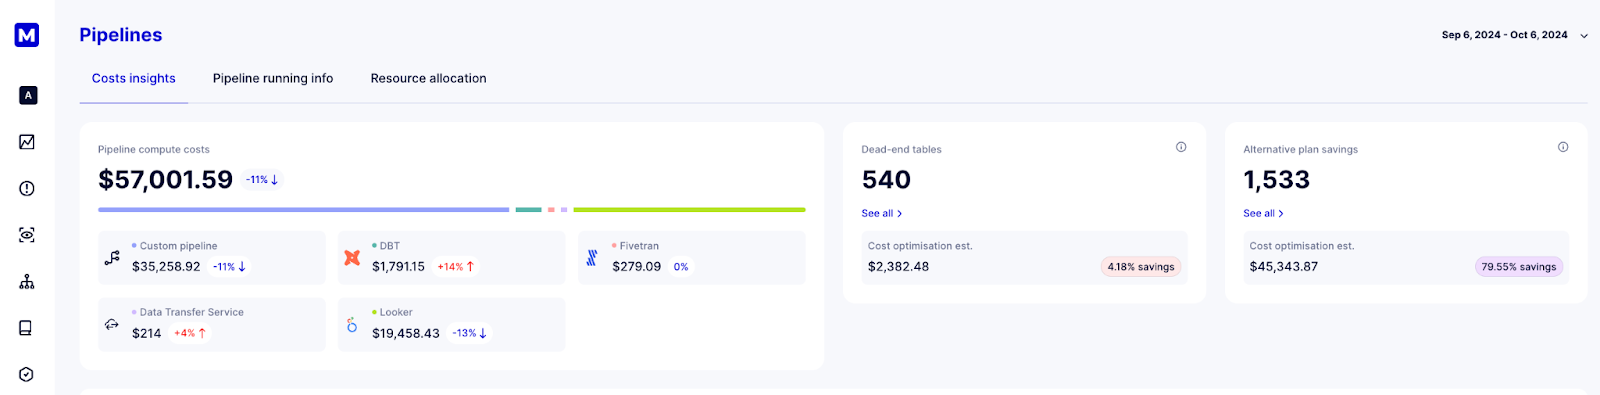
We give our users a clear guidance which pipeline is better be running on slots and which is better be in GiB. In matter of 1 hour we generate a report with estimated cost optimization with clear action plan which pipelines should be allocated to which billing model: On-demand or Editions.Â
Masthead UI screenshot
Example
Here is team that can go from paying $57K for their automated processes and pipelines in BigQuery to just $14K”“$15K.
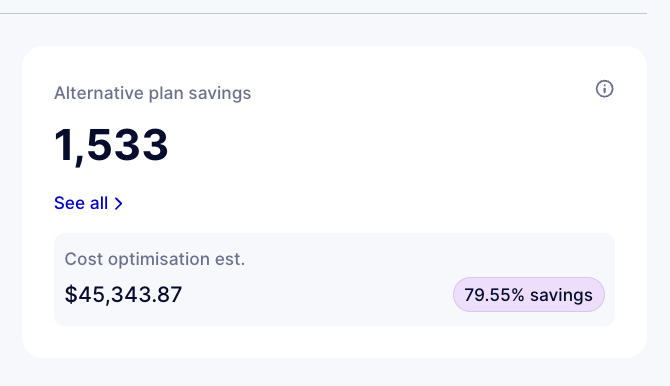
Close up for the Alternative plan savings widget
That sounds too good to be true, unless we can prove it. 🙂
Step by Step Feature Guide
Within 30 minutes after deployment, we generate a report that shows the cost of pipelines under an alternative billing plan, comparing current consumption to what it could be. For instance, if your data is currently billed in GiB (On-Demand plan), we’ll show the GiB consumption per pipeline in the UI alongside the equivalent in slots for the same time period. We’ll then calculate the costs for the Editions Standard billing plan (the pay-as-you-go version).
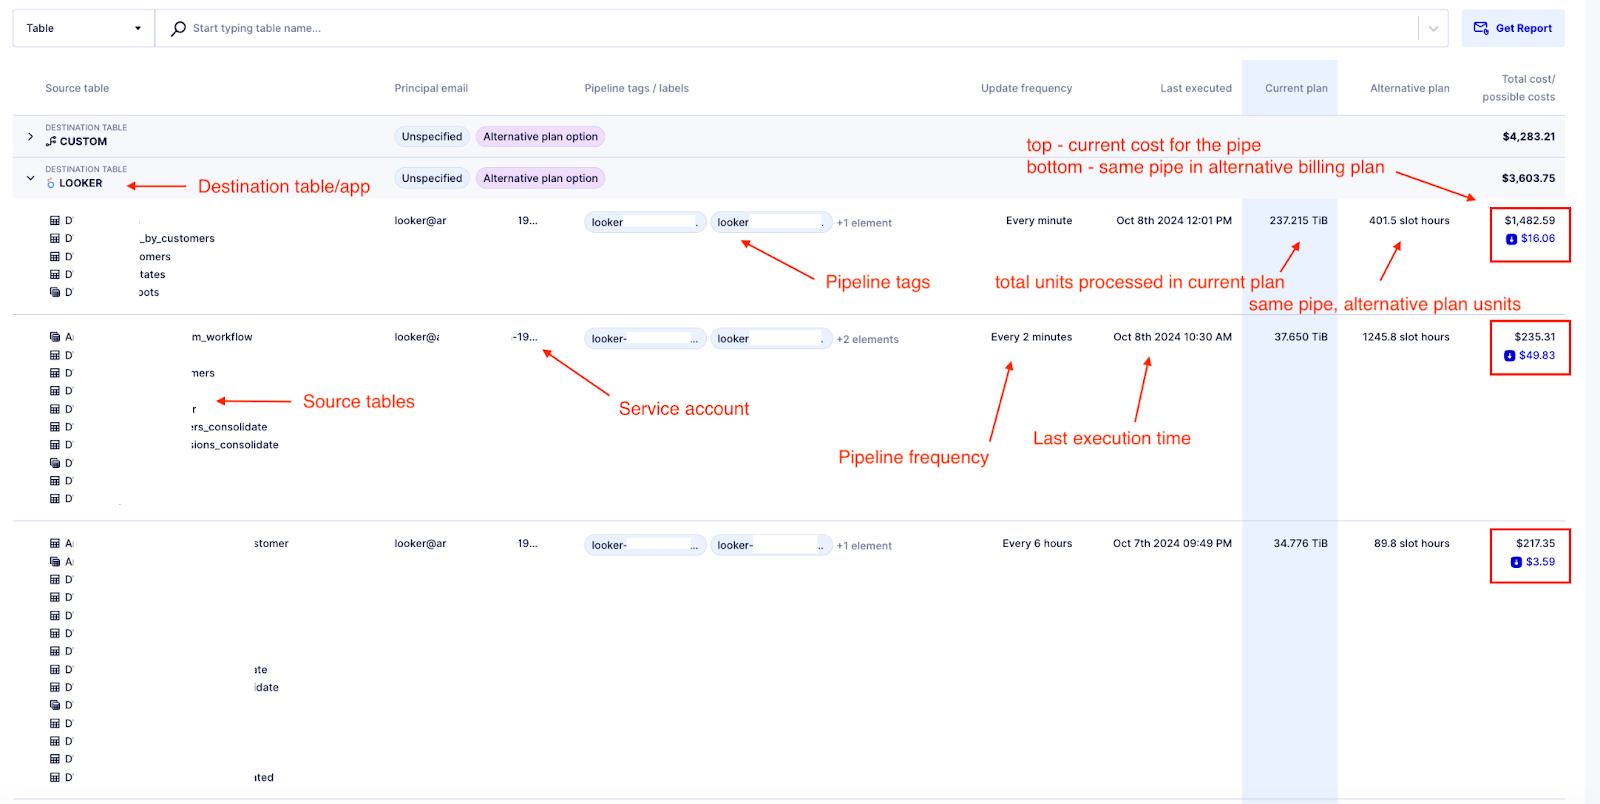
Screenshot from Masthead UI
This is how it look like. On the left, you have a process with the destination table at the top, in this case, Looker dashboards. At the bottom are the source tables or views. The second column shows the service account, followed by the pipeline labels in the third column. The fourth column displays the frequency of the pipeline runs, and the fifth column shows the last execution time.
The sixth column (in blue) represents the consumption in units under the current billing plan, while the seventh column shows the consumption in units under the alternative plan. The eighth column, at the top, shows the total cost of running the pipeline on the current billing plan. At the bottom, in blue, it shows the potential cost of running the same pipeline under the Editions Standard plan.
This comparison is not meant to prove that Editions is always the better option. It works both ways. For some clients, we find it makes sense to switch back to On-demand, while for others, there’s a great opportunity to move 50% of their workloads to Editions and save up to 70% on BigQuery compute costs. It really depends on the project workloads.
Below is an example from the same project, where in this case, it doesn’t make sense to switch to Editions.

Choosing the right billing plan can save up to 50% on your BigQuery costs. Try Masthead and see for yourself.
It’s worth checking out, as you’ll see results within 30 minutes after deployment.
The deployment takes up to 15 minutes. We don’t require permissions to query your data, and we don’t need your information schema either. We do everything through logs, which makes the process fast, secure, and without any additional cost to your BigQuery bill.