How BigQuery fluid autoscaling eliminates the scale-down latency tax
If you run BigQuery on GCP at scale, you are likely familiar with the challenge of capacity management. To keep query performance predictable while controlling costs, platform specialists dynamically scale slots up and down. However, standard autoscaling introduces a hidden cost: scale-down latency. Because standard autoscaling scales down in coarse increments and waits several minutes after a workload spike before releasing capacity, you pay for slots that you do not use.
This overhead is known as the scale-down latency tax.
Google recently released Fluid Autoscaling, a powerful platform upgrade that addresses this inefficiency by allocating and billing slot capacity dynamically on a second-by-second basis, rounded to 50-slot steps.
To help you understand the impact of this change, Masthead conducted a retrospective scale analysis. We analyzed a cohort of 47 active reservations—representing the early migrations we observed among our customer base during the first month of this feature's availability. This article shares the key economic and performance insights from the analysis, revealing just how much optimization potential remains untapped across the wider BigQuery landscape.
The economics of Fluid autoscaling
This initial sample of 47 active reservations (representing a total managed capacity limit of 45,500 slots) reveals a massive efficiency improvement:
Compute capacity reduction: A 26.66% reduction in overall autoscale compute requirements
Projected cumulative yearly savings: Over $1.5 Million
Autoscaling efficiency boost: The overall usage share (efficiency) rose from 70.76% under Standard autoscaling to 98.13% under Fluid autoscaling.
This means that over $1.5 million in annual cloud spend was wasted due to standard autoscaling's slow scale-down across just this early cohort. With many reservations yet to migrate, the total potential savings waiting to be unlocked across the broader customer base is significant. Google's precise billing engineering, paired with Masthead's detailed observability, enables organizations to identify and reclaim this waste.
Visualizing the savings
To understand how reservation size affects efficiency, the following fleet-wide scatter plot maps standard autoscaling efficiency against reservation size categories, with each point colored by its Fluid savings percentage.
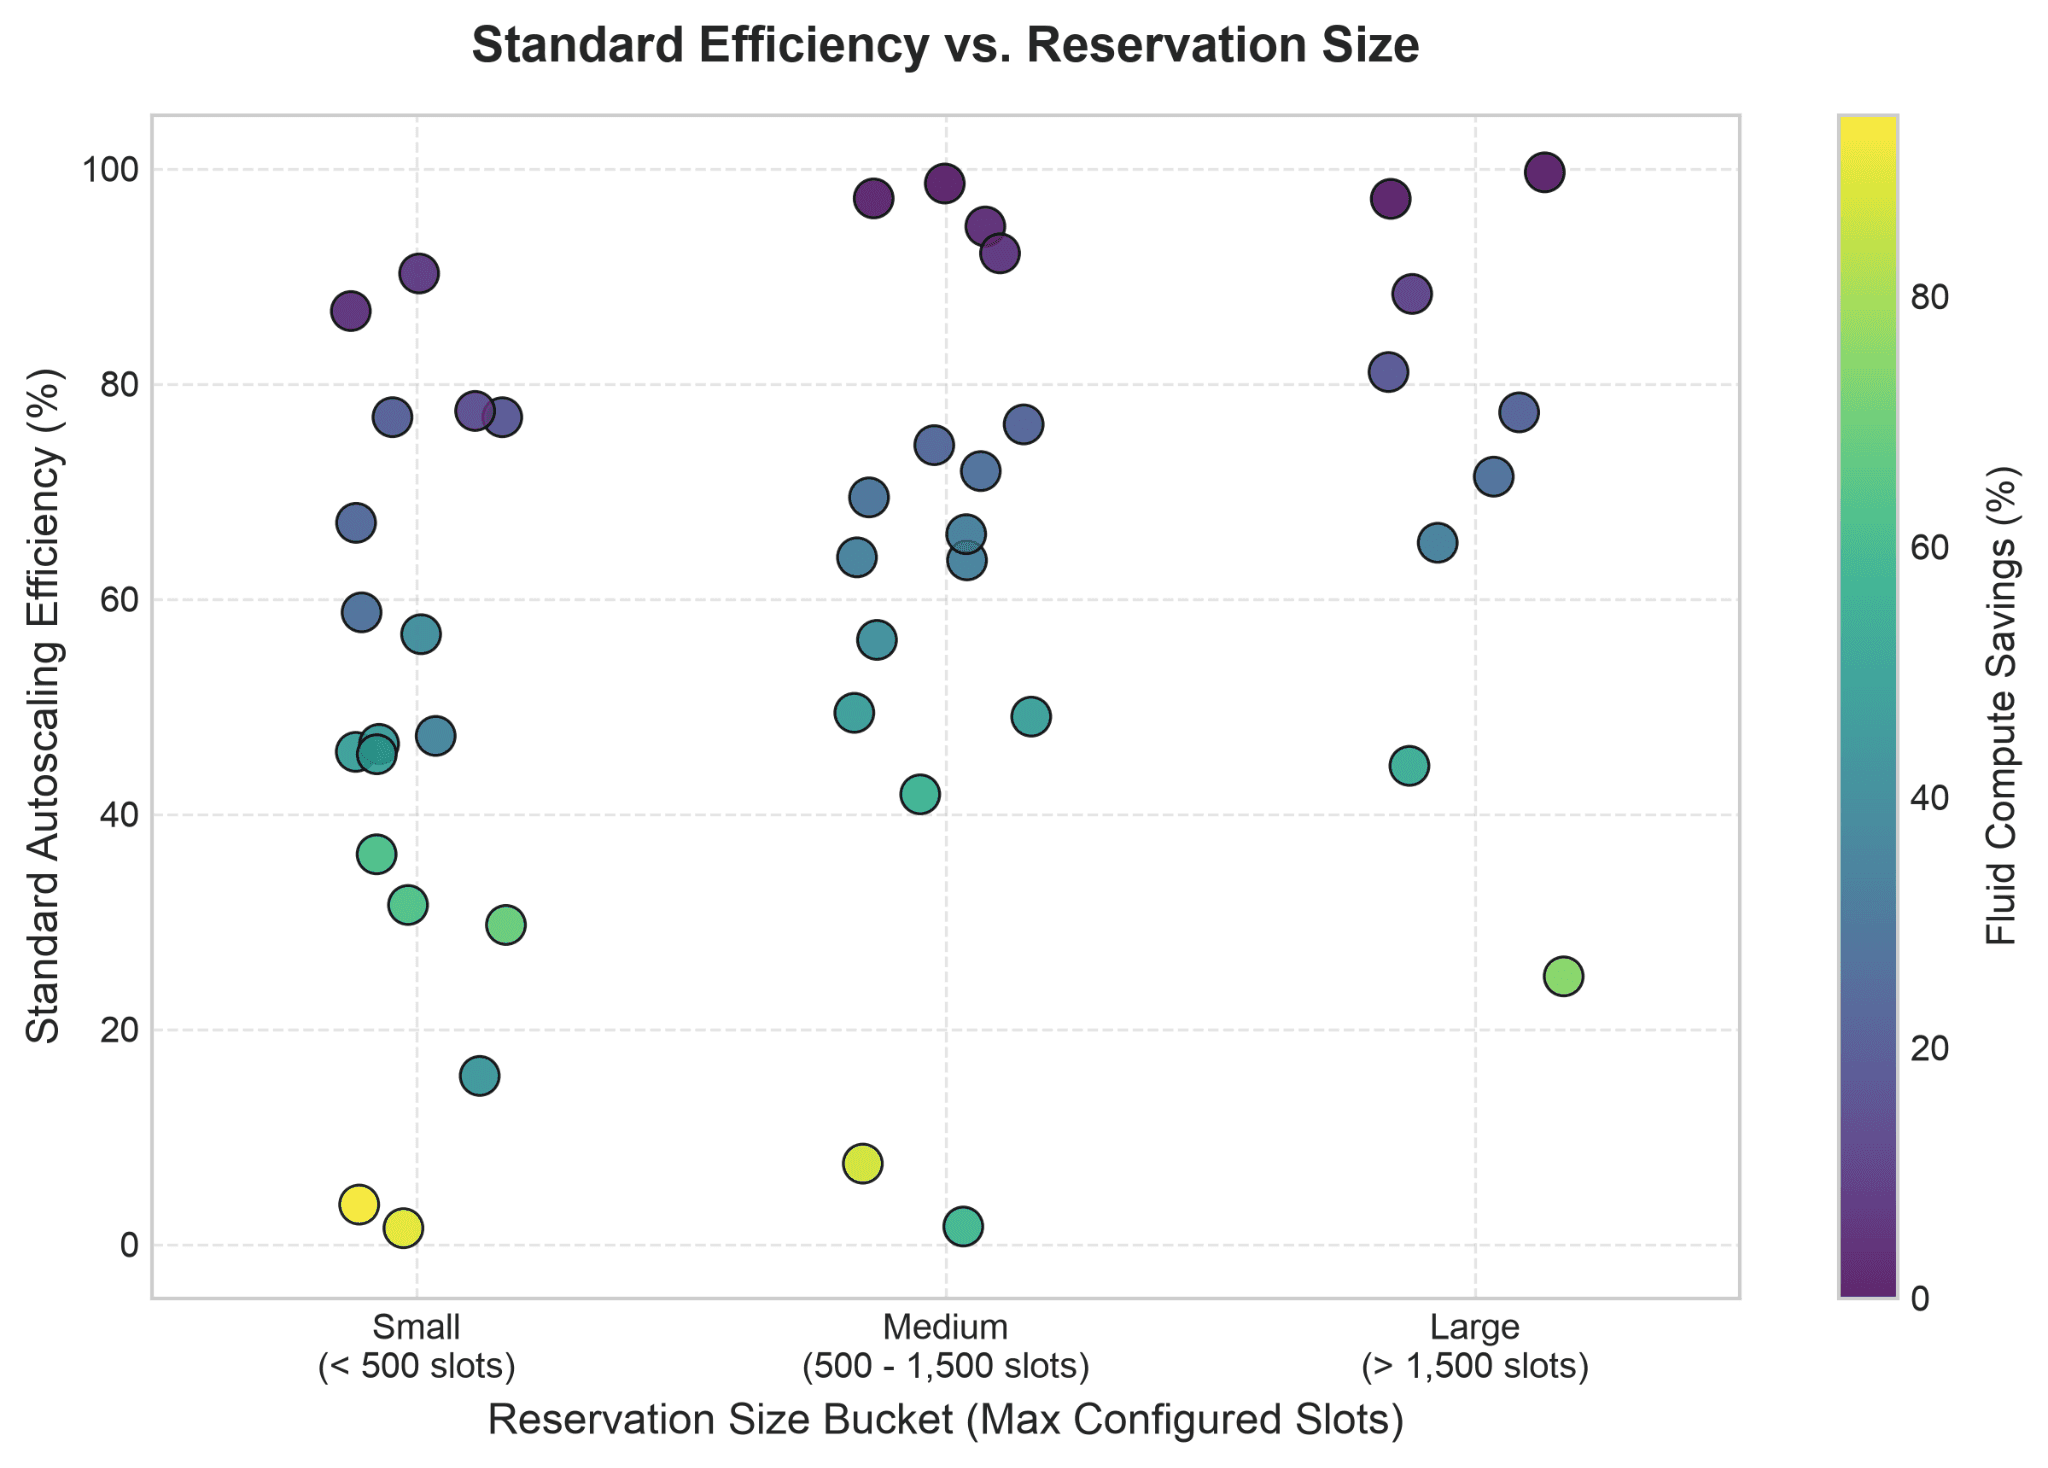
Figure 1. Scatter plot showing standard autoscaling efficiency (y-axis) grouped by reservation size categories (x-axis: Small, Medium, Large). Points are colored by their Fluid savings percentage.
The scatter plot reveals two critical patterns about who benefits most from Fluid autoscaling:
Fleet-Wide Savings: Almost every active reservation (represented by the points) achieved positive savings, with a majority seeing cost reductions between 20% and 60% (as shown by the green and yellow color spectrum). The scale-down latency tax affects almost every workload that exhibits bursty, intermittent, or fluctuating query activity.
The Efficiency Tax on Smaller Reservations: Smaller reservations (those with max configured capacity under 500 slots) suffer from the lowest standard autoscaling efficiency, with many running below 40% efficiency. This occurs because standard autoscaling's coarse step-sizing and scaling increments disproportionately impact smaller workloads. Under Fluid autoscaling, these smaller workloads see their efficiency rise to nearly 95%-99%, making them the primary percentage beneficiaries. However, while smaller reservations see higher percentage savings, the absolute financial savings are dominated by high-throughput, large-scale reservations.
Case study: A production reservation
To understand the practical impact, the following section examines a 30-day retrospective lookback window for a production reservation (an Enterprise Edition customer in the U.S. multi-region) that migrated to Fluid autoscaling.
The reservation operates with a baseline commitment of 300 slots, which are covered by existing commitments and excluded from this cost analysis. Above this baseline, the reservation scales dynamically using Fluid autoscaling. To quantify the benefit of the migration, the active workload data was mapped to compare the actual Fluid autoscaling billed slots against the simulated Standard autoscaling capacity that would have been billed otherwise.
Autoscale slots usage share (efficiency): Under Standard autoscaling, efficiency would have been only 51.79%, meaning nearly half the billed autoscaling slots would be wasted. Under the actual Fluid autoscaling, efficiency rose to 93.77%.
Billing reduction: Actual autoscale compute capacity and monthly costs dropped by 44.77% (a near-halving of the autoscaling bill).
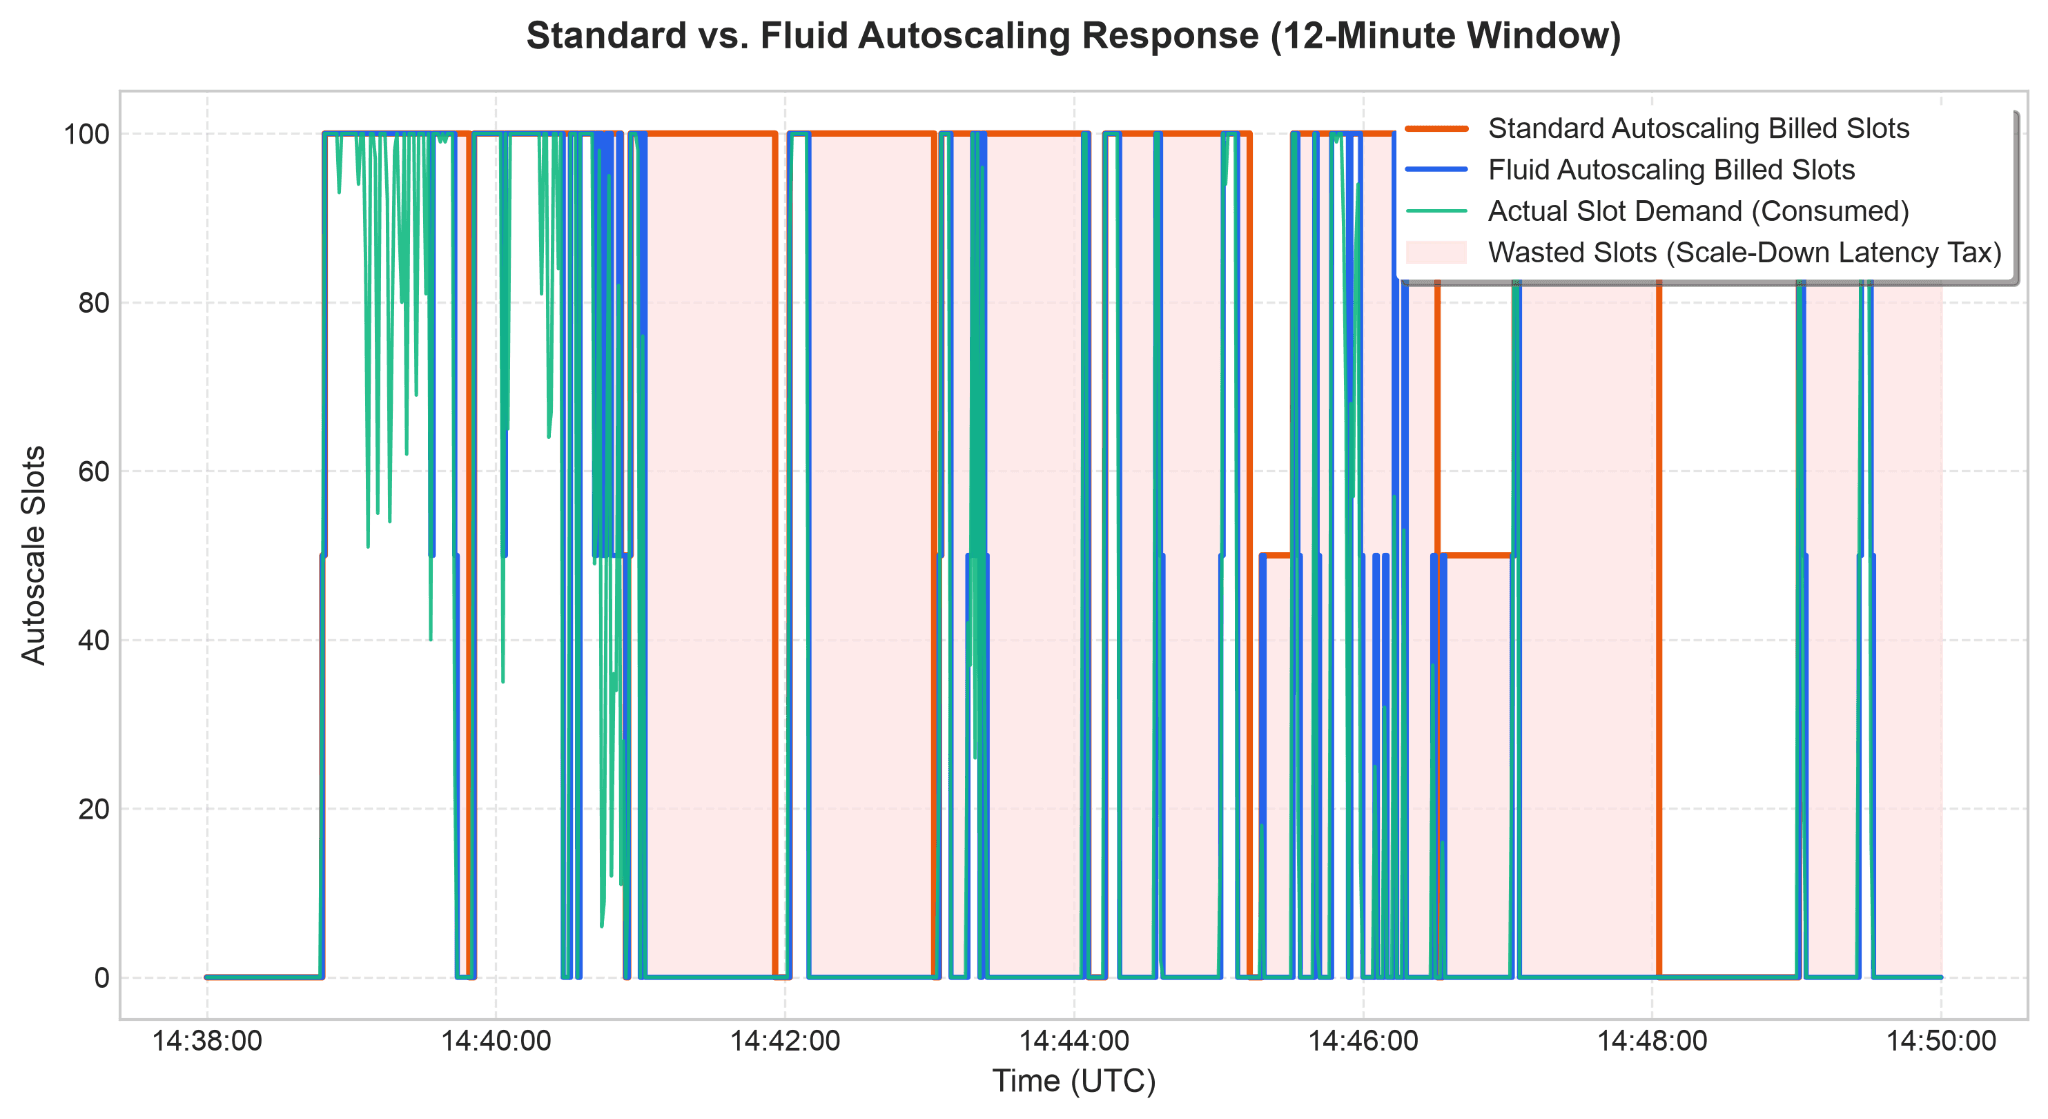
Figure 2. Second-by-second slot allocation for a production reservation over a 12-minute window (14:38 to 14:50 UTC). The blue line represents the actual Fluid Autoscaling billed capacity in production, the green line represents actual query demand, and the orange line maps the simulated Standard Autoscaling capacity. The light red shaded region highlights the wasted capacity that would have occurred due to standard autoscaling's scale-down latency.
The timeline chart above illustrates the scale-down latency tax in action. When a query spike ends at 14:40:15, the actual Fluid Autoscaling capacity (blue line) drops back to 0 instantly to match the actual demand (green line). Standard Autoscaling (orange line), by contrast, would have kept 100 slots allocated and billed for over 8 minutes before scaling down, resulting in the light red shaded region of complete waste.
By switching to Fluid autoscaling, the customer eliminated this scale-down latency overhead without altering their baseline commitment.
Workload performance: The real-world truth
For platform specialists, cost reduction must not come at the expense of query performance. Engineering leaders often worry that second-by-second capacity scaling might throttle queries or increase execution times.
To address this concern, Masthead analyzed the execution durations across the cohort of 47 reservations that migrated to Fluid autoscaling. The analysis compared a 7-day period before the switch with a 7-day period after the switch, using matching weekdays to eliminate seasonality. A two-sided Mann-Whitney U test determined the statistical significance of any performance shifts.
The findings reveal a workload-dependent performance impact rather than a general regression. Crucially, the observed changes were highly non-symmetric: performance improvements were substantial and immediately visible, whereas performance regressions were minor and operationally negligible:
Statistically significant change: 38 out of 47 reservations showed a significant shift in query durations (where p-value < 0.05).
Durations decreased (performance improved): 21 reservations ran faster. For example, a production orchestration workload with a stable query mix saw average durations drop by 13.1% (and P95 durations by 10.0%). Even workloads where query complexity increased saw duration reductions of up to 14%.
Durations increased (performance regressed): 17 reservations ran slower. However, these regressions typically amounted to sub-second increases at the median and P95 levels, representing operationally negligible shifts that had no impact on business operations.
No significant change: 9 reservations showed no statistical change in query duration.
To address concerns that these duration shifts are a statistical illusion caused by changes in query composition, we controlled for workload complexity (measured by average slot-hours per job). The analysis confirms true performance gains: workloads with completely stable query mixes ran 10% to 13% faster, and even those with heavier query mixes saw execution times drop.
Because the performance impact varies by workload, migrating to Fluid autoscaling does not guarantee a performance regression. In fact, many workloads run faster due to lighter cluster activity or other platform optimizations.
Conclusion and next steps
The transition to Fluid autoscaling represents a significant step forward in data warehouse efficiency. However, capacity adjustments can be daunting for engineering leaders concerned about SLA regressions or budget overruns.
Masthead eliminates this risk by making reservation management 100% proactive. Through granular, query-level simulations, Masthead models changes before they hit production, offering both cost optimizations with performance guardrails, and performance improvements with strict cost controls. This bi-directional predictability ensures that every workload migration and reservation adjustment remains completely safe and controlled.
To evaluate your potential savings safely, you can run a retrospective simulation on your BigQuery reservation data. If you decide to proceed with the migration, execute the following DDL statement in your GCP administration console to activate Fluid autoscaling for a reservation:
ALTER PROJECT `your-admin-project-id`
SET OPTIONS (
`region-us.preflight_fluid_autoscaling_reservations` = ["your-reservation-name"]
);
By understanding your workload characteristics and leveraging precise telemetry, you can reclaim your slot capacity and optimize your GCP spend.